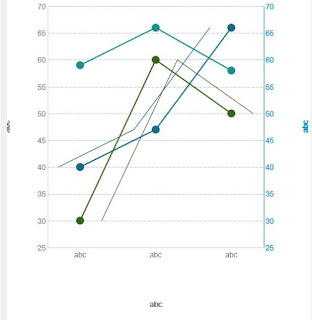
Cognos Rave Visualization MultiLine Chart
Environment: Cognos 10.2.2
High Level Steps done as follow:-
1. Open given Combination Chart as base in IBM Visualization Customizer Tool
2. Replace Bar Charts from data set sections, Elements sections with Line chart data
3. Change Colors for both data sources to show different colors
4. if needed, remove legend or position to appropriate place.
After the change:
Use:
To show different measures of same dimensions in same chart for comparison.
